
In today's tutorial, you are going to learn about WebSockets and how you can use them to create interactive realtime data applications.
To illustrate just how innovative real time technologies are, we will build a chart application which automatically updates with new dynamic online data.
This is going to be a really good example of how we can implement user data into useful commercial products such as sports leaderboards, social media analytics, financial money trackers, medical instruments, games and many more.
As you can see, there are numerous use cases for this technology. So let's get under way and first learn about the main platform that we will be using to create our realtime data: Pusher.
You can find the codebase online here.
Prerequisites
- An IDE/code editor installed
- Basic knowledge of JavaScript and React
- An understanding of Node.js and npm
- An account on Pusher
Table of Contents
- What are WebSockets?
- What is Pusher?
- What we will be building
- How to Create an Account on Pusher
- How to Build the Company Annual Income Application
- Conclusion
What are WebSockets?
WebSockets are a communications protocol which allows for data to travel bidirectionally between a client and a server. This essentially means that it's possible for a client and server to simultaneously send data back and forth independently of each other.
Being able to send data this way brings many advantages, such as preventing blocking. This can occur if the system is only capable of either sending or receiving and not both at the same time.
Another advantage is the fact that the Transmission Control Protocol (TCP) connection remains long-lived and connected. This is a drawback of traditional Hypertext Transfer Protocol (HTTP) connections, as they are regularly opening and closing each time there is a request or a response. This prevents communication from being instant and realtime.
Not having to worry about the opening and closing of connections results in dramatically less network traffic – so in terms of speed and resources, this is a welcome bonus.
Now that you know why WebSockets are helpful, let's take a look at Pusher and see what the platform is capable of.
What is Pusher?
Pusher is an online platform you can use to build and develop applications that require real-time communication. These communications typically take place between web browsers, mobile phones, and other internet connected devices.
The platform is designed to make it easy to implement real-time communication systems which are nowhere near as complicated as raw WebSocket connections in terms of setup and management. This allows for better scaling and even a way to handle fallbacks for legacy environments that do not support WebSockets.
Pusher is capable of using numerous technologies such as WebSockets, HTTP fallbacks, and even its own propriety protocol called ws-longpolling. This enables the platform to work in places where WebSockets is not supported.
Pusher also has a lot of other useful features. For example, it fully supports WebSockets, so bidirectional communication works as you would expect. The platform also follows the publish-subscribe (Pub/Sub) pattern which is a popular messaging pattern used in the industry. It pretty much guarantees that anyone subscribed to any of the channels can receive the messages in realtime.
A good example of this would be everyone getting the latest news notification who is subscribed to that social media channel. Subscriptions can be public and private, which requires authentication to gain access to those messages.
There's also wide platform support, as the Pusher SDK is available in different programming languages like JavaScript, Python, iOS, Android and many others. It's available as a service online, so all of the scaling and communications infrastructure is already handled. This means one less system for developers to handle when building an application.
Pusher is a great option, as I hope you can tell. But there are other tools out there that do similar things:
Ok, you've learned quite a lot about WebSockets and Pusher. Now, we'll take a look at the application that we are going to build.
What We Will Be Building
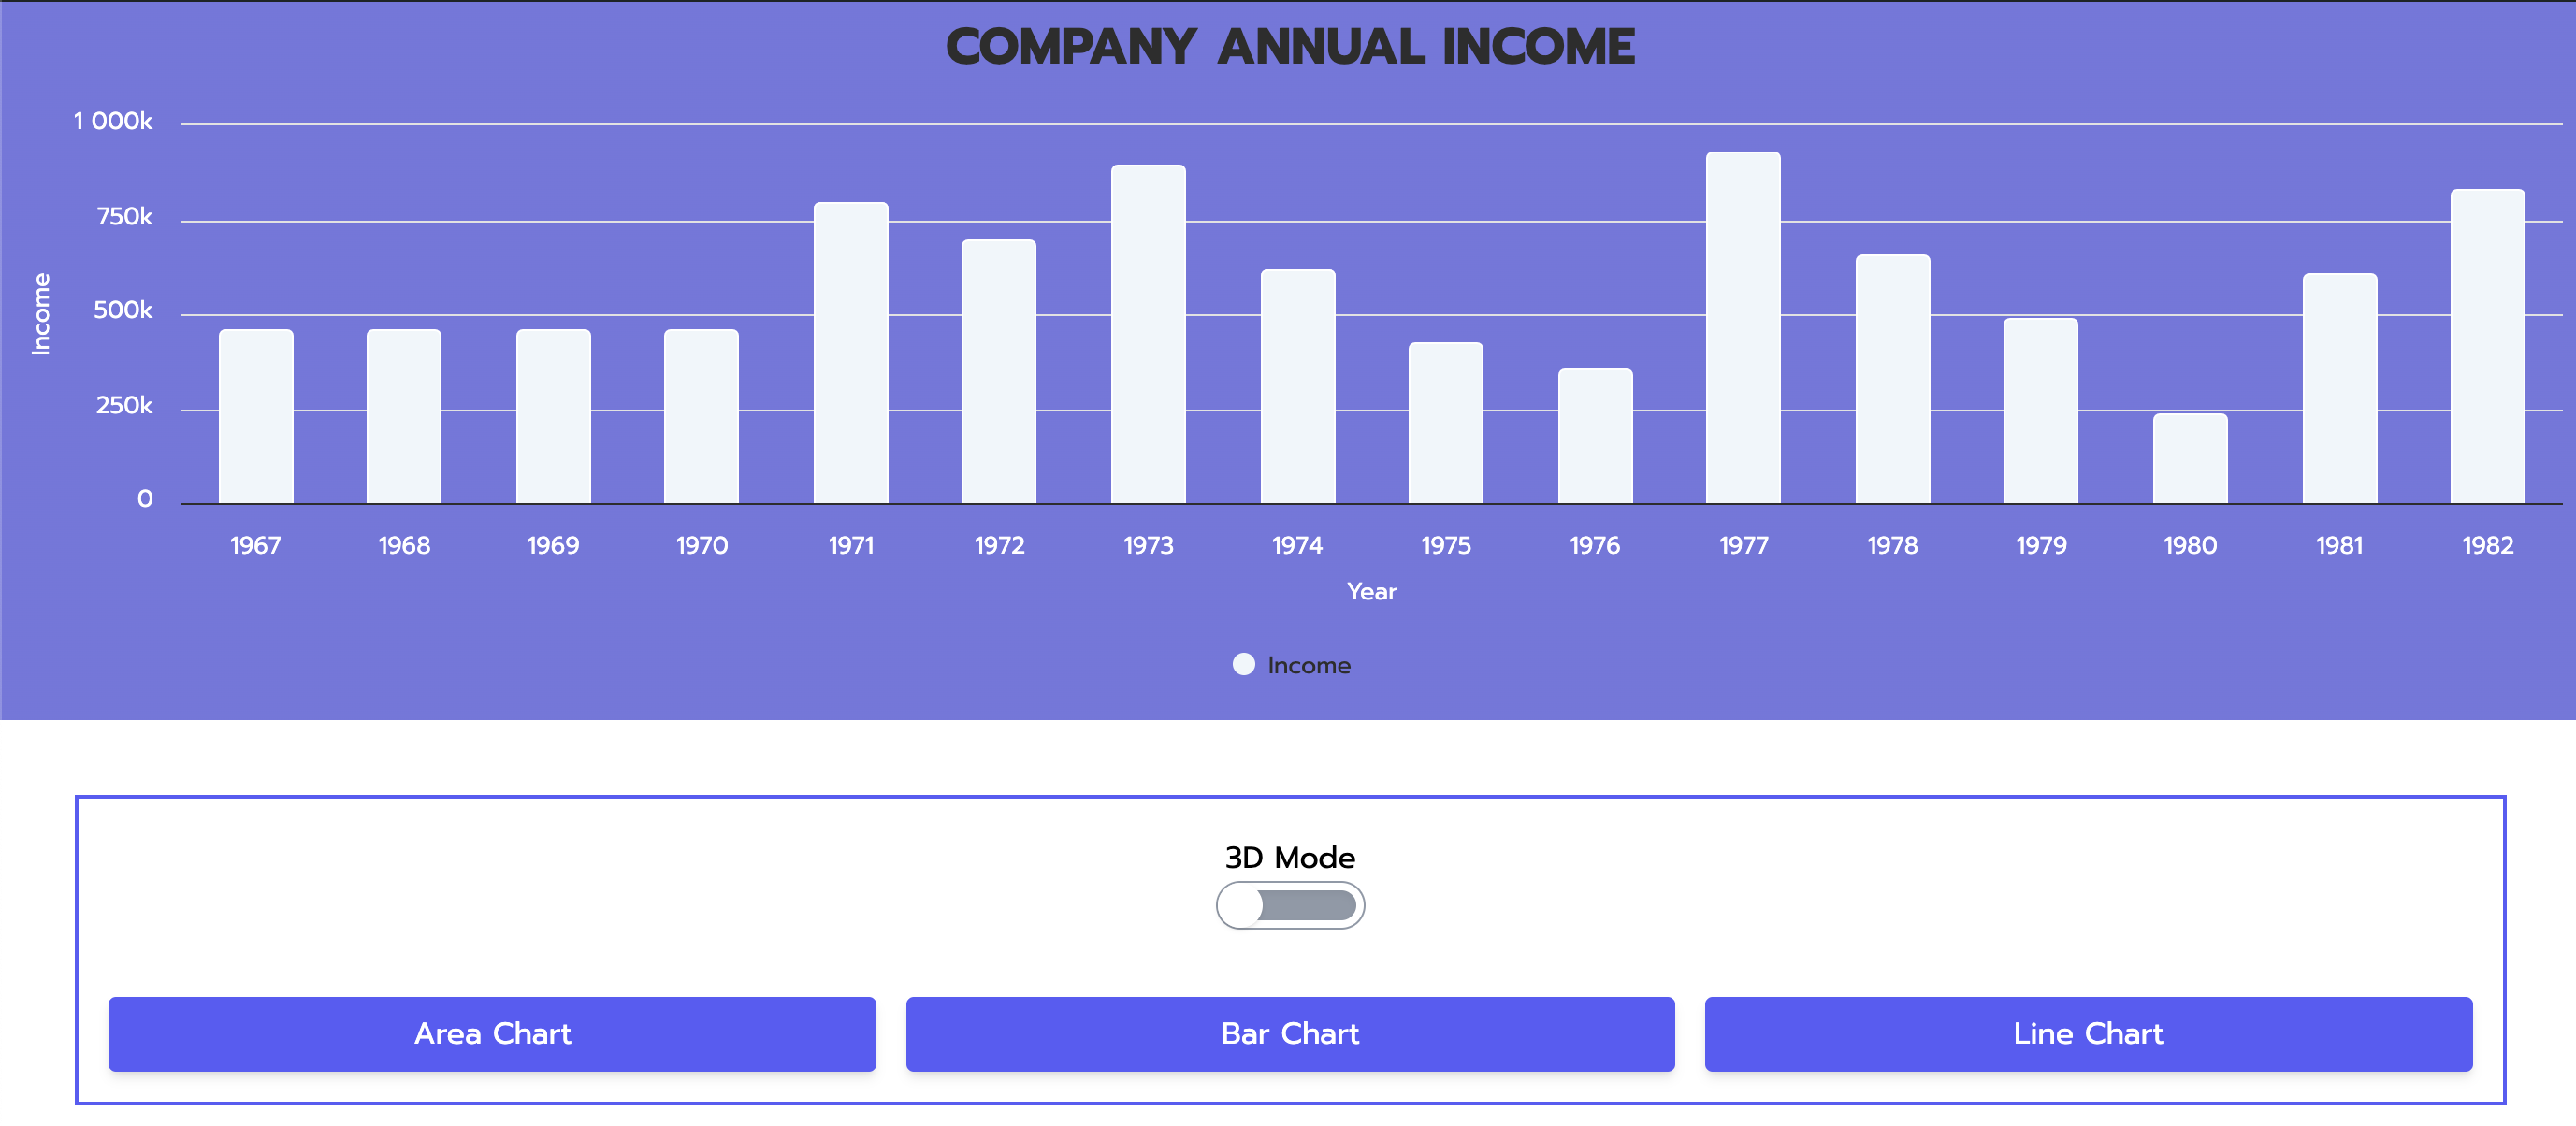
To help you learn how Pusher works, we are going to build a Company Annual Income dashboard application. The application has a graph, a 3D Mode toggle, and three buttons.
We'll build our application using Next.js, Pusher, and HighCharts (the tool that we'll use to create our graph component). This will be a full stack application with one API endpoint for our Pusher REST API. We just need one GET endpoint which will connect to the Pusher API.
The graph data will come directly from Pusher, and the 3D Mode toggle essentially lets us switch our chart between 2D and 3D mode. The buttons let us change the type of chart that is displayed on screen, and all 3 charts can work in 2D and 3D mode. The chart has some starting data, and new data is automatically added to the end for each new year.
Here you can see our Company Annual Income Application in 2D Graph Mode.
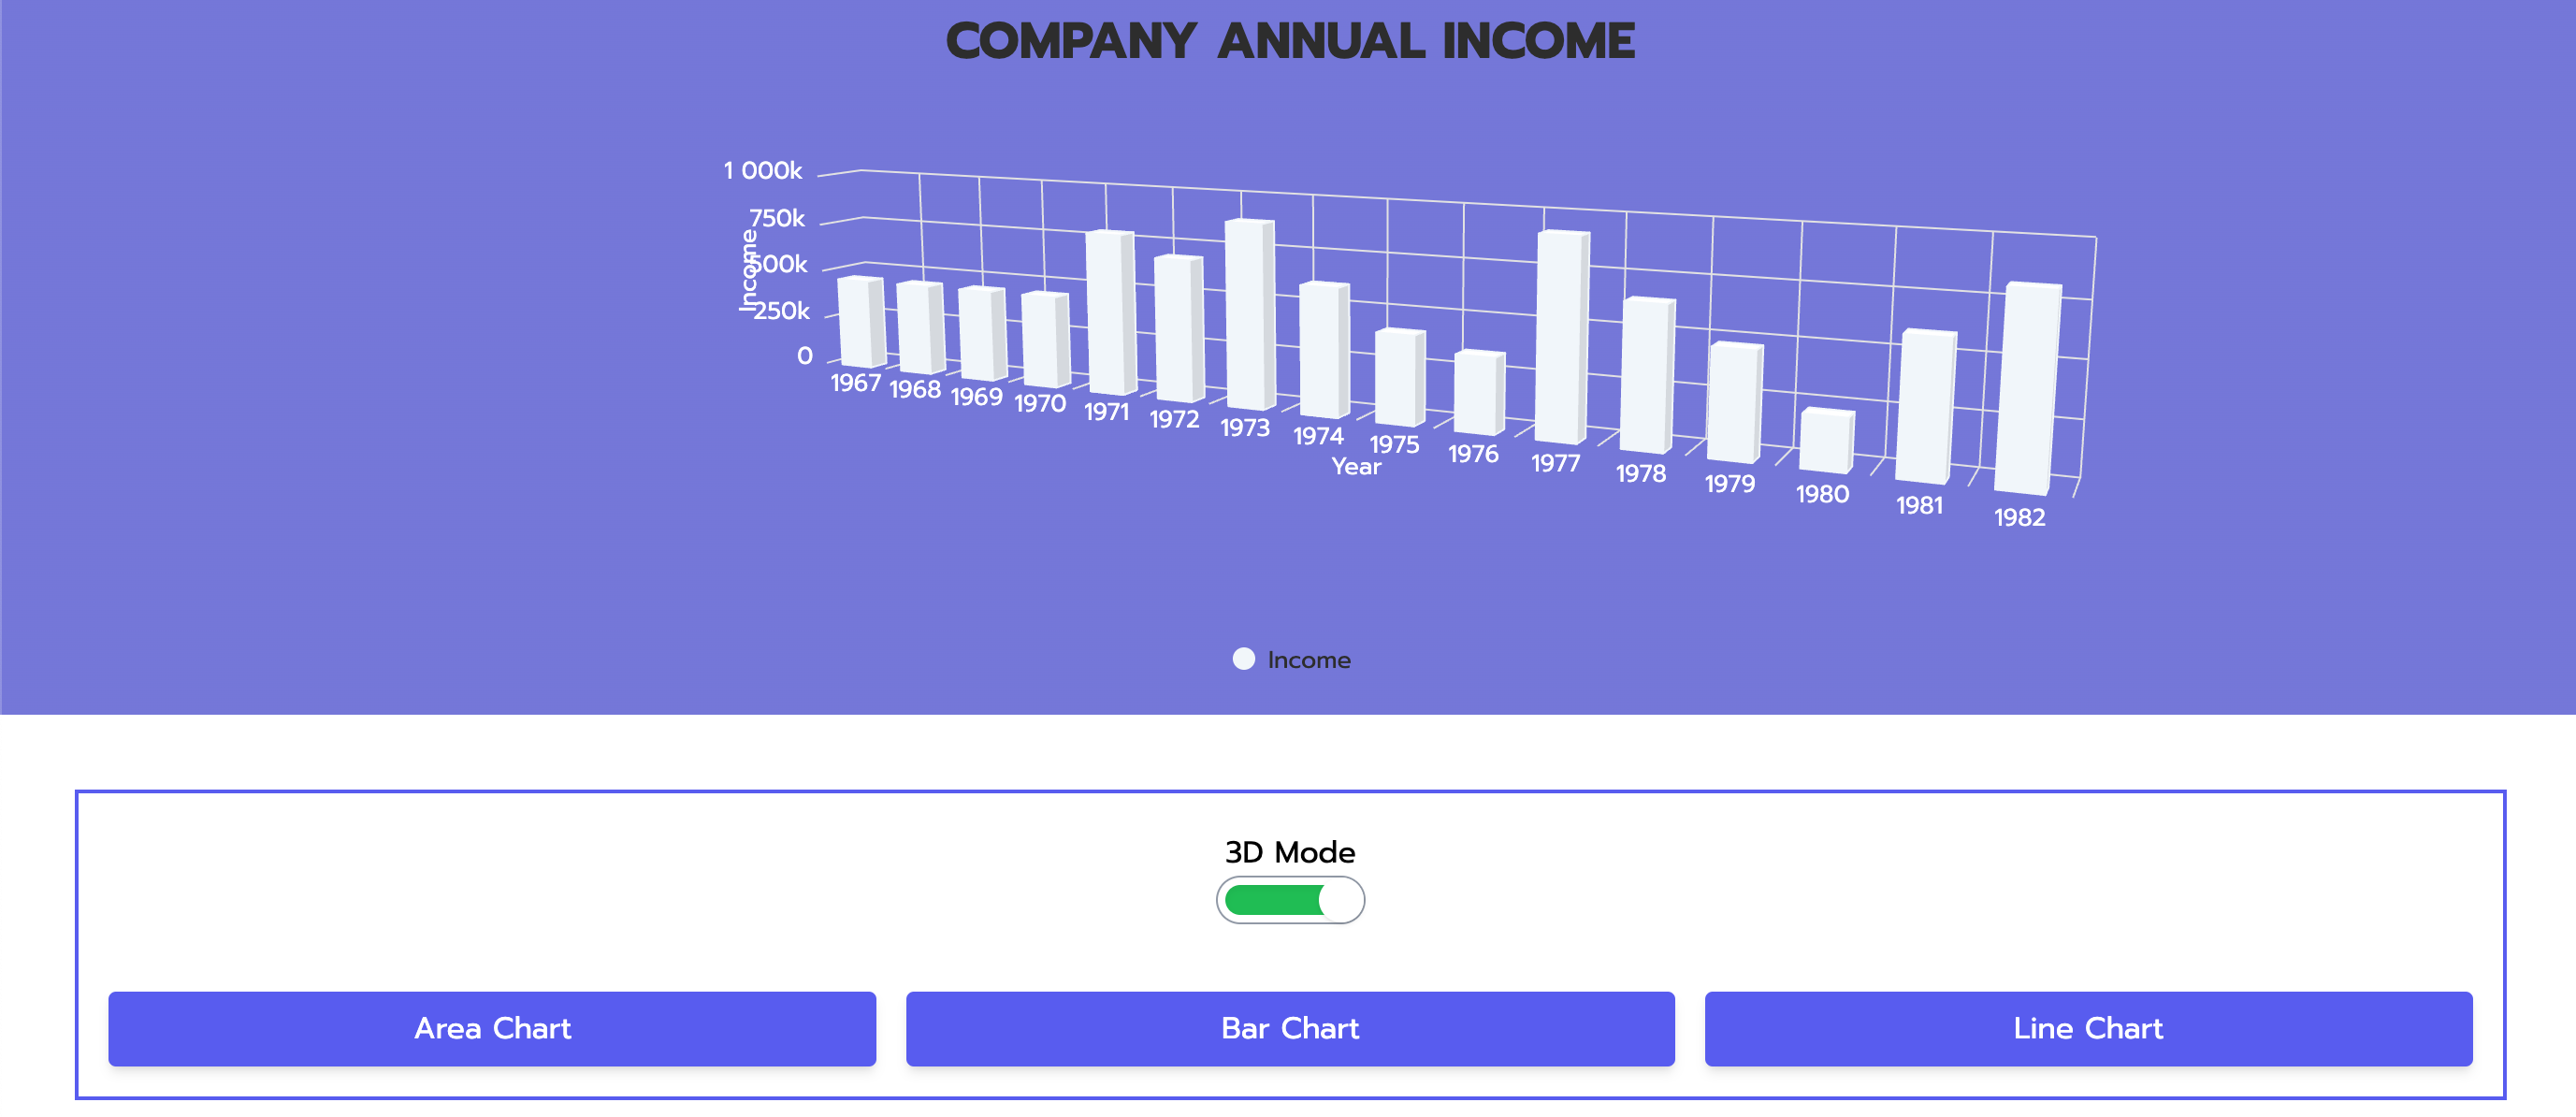
And here you can see our Company Annual Income Application in 3D Graph Mode.
As you can see, the HighCharts library is very good when it comes to building applications that require data visualisation. If you are interested in other libraries which work just as well, I have put together a list of some of them here. Each one has its own unique benefits and it's possible to use more than one library if you want to:
Alright, we know what we are going to build. In the next section, we will quickly go through how to create an account on Pusher followed by actually building our application afterwards.
How to Create an Account on Pusher
Creating an account on Pusher only requires a few steps. Depending on when you follow this tutorial, the website might look a bit different – but the sign up process should be the same.
Start by going to the Pusher website as shown below:

Click on either the Get your free account button in the middle of the page, or the Sign up button in the top right hand corner.
You should now be on the Sign up page as shown here:

Either use your GitHub, Google, or email to create an account.
The next page to load should be your main dashboard after you have completed the sign up as shown in the image below:
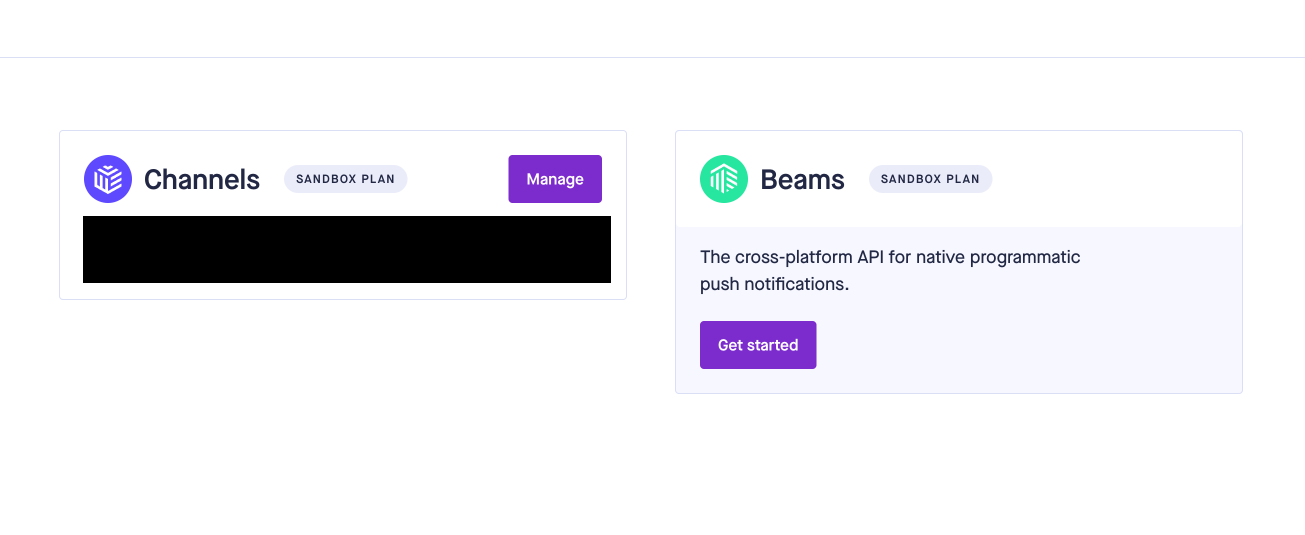
Click on the Manage button in the Channels section in the image shown above to get to the Channels page.
The Channels page can be seen below which displays all of the data for our app.
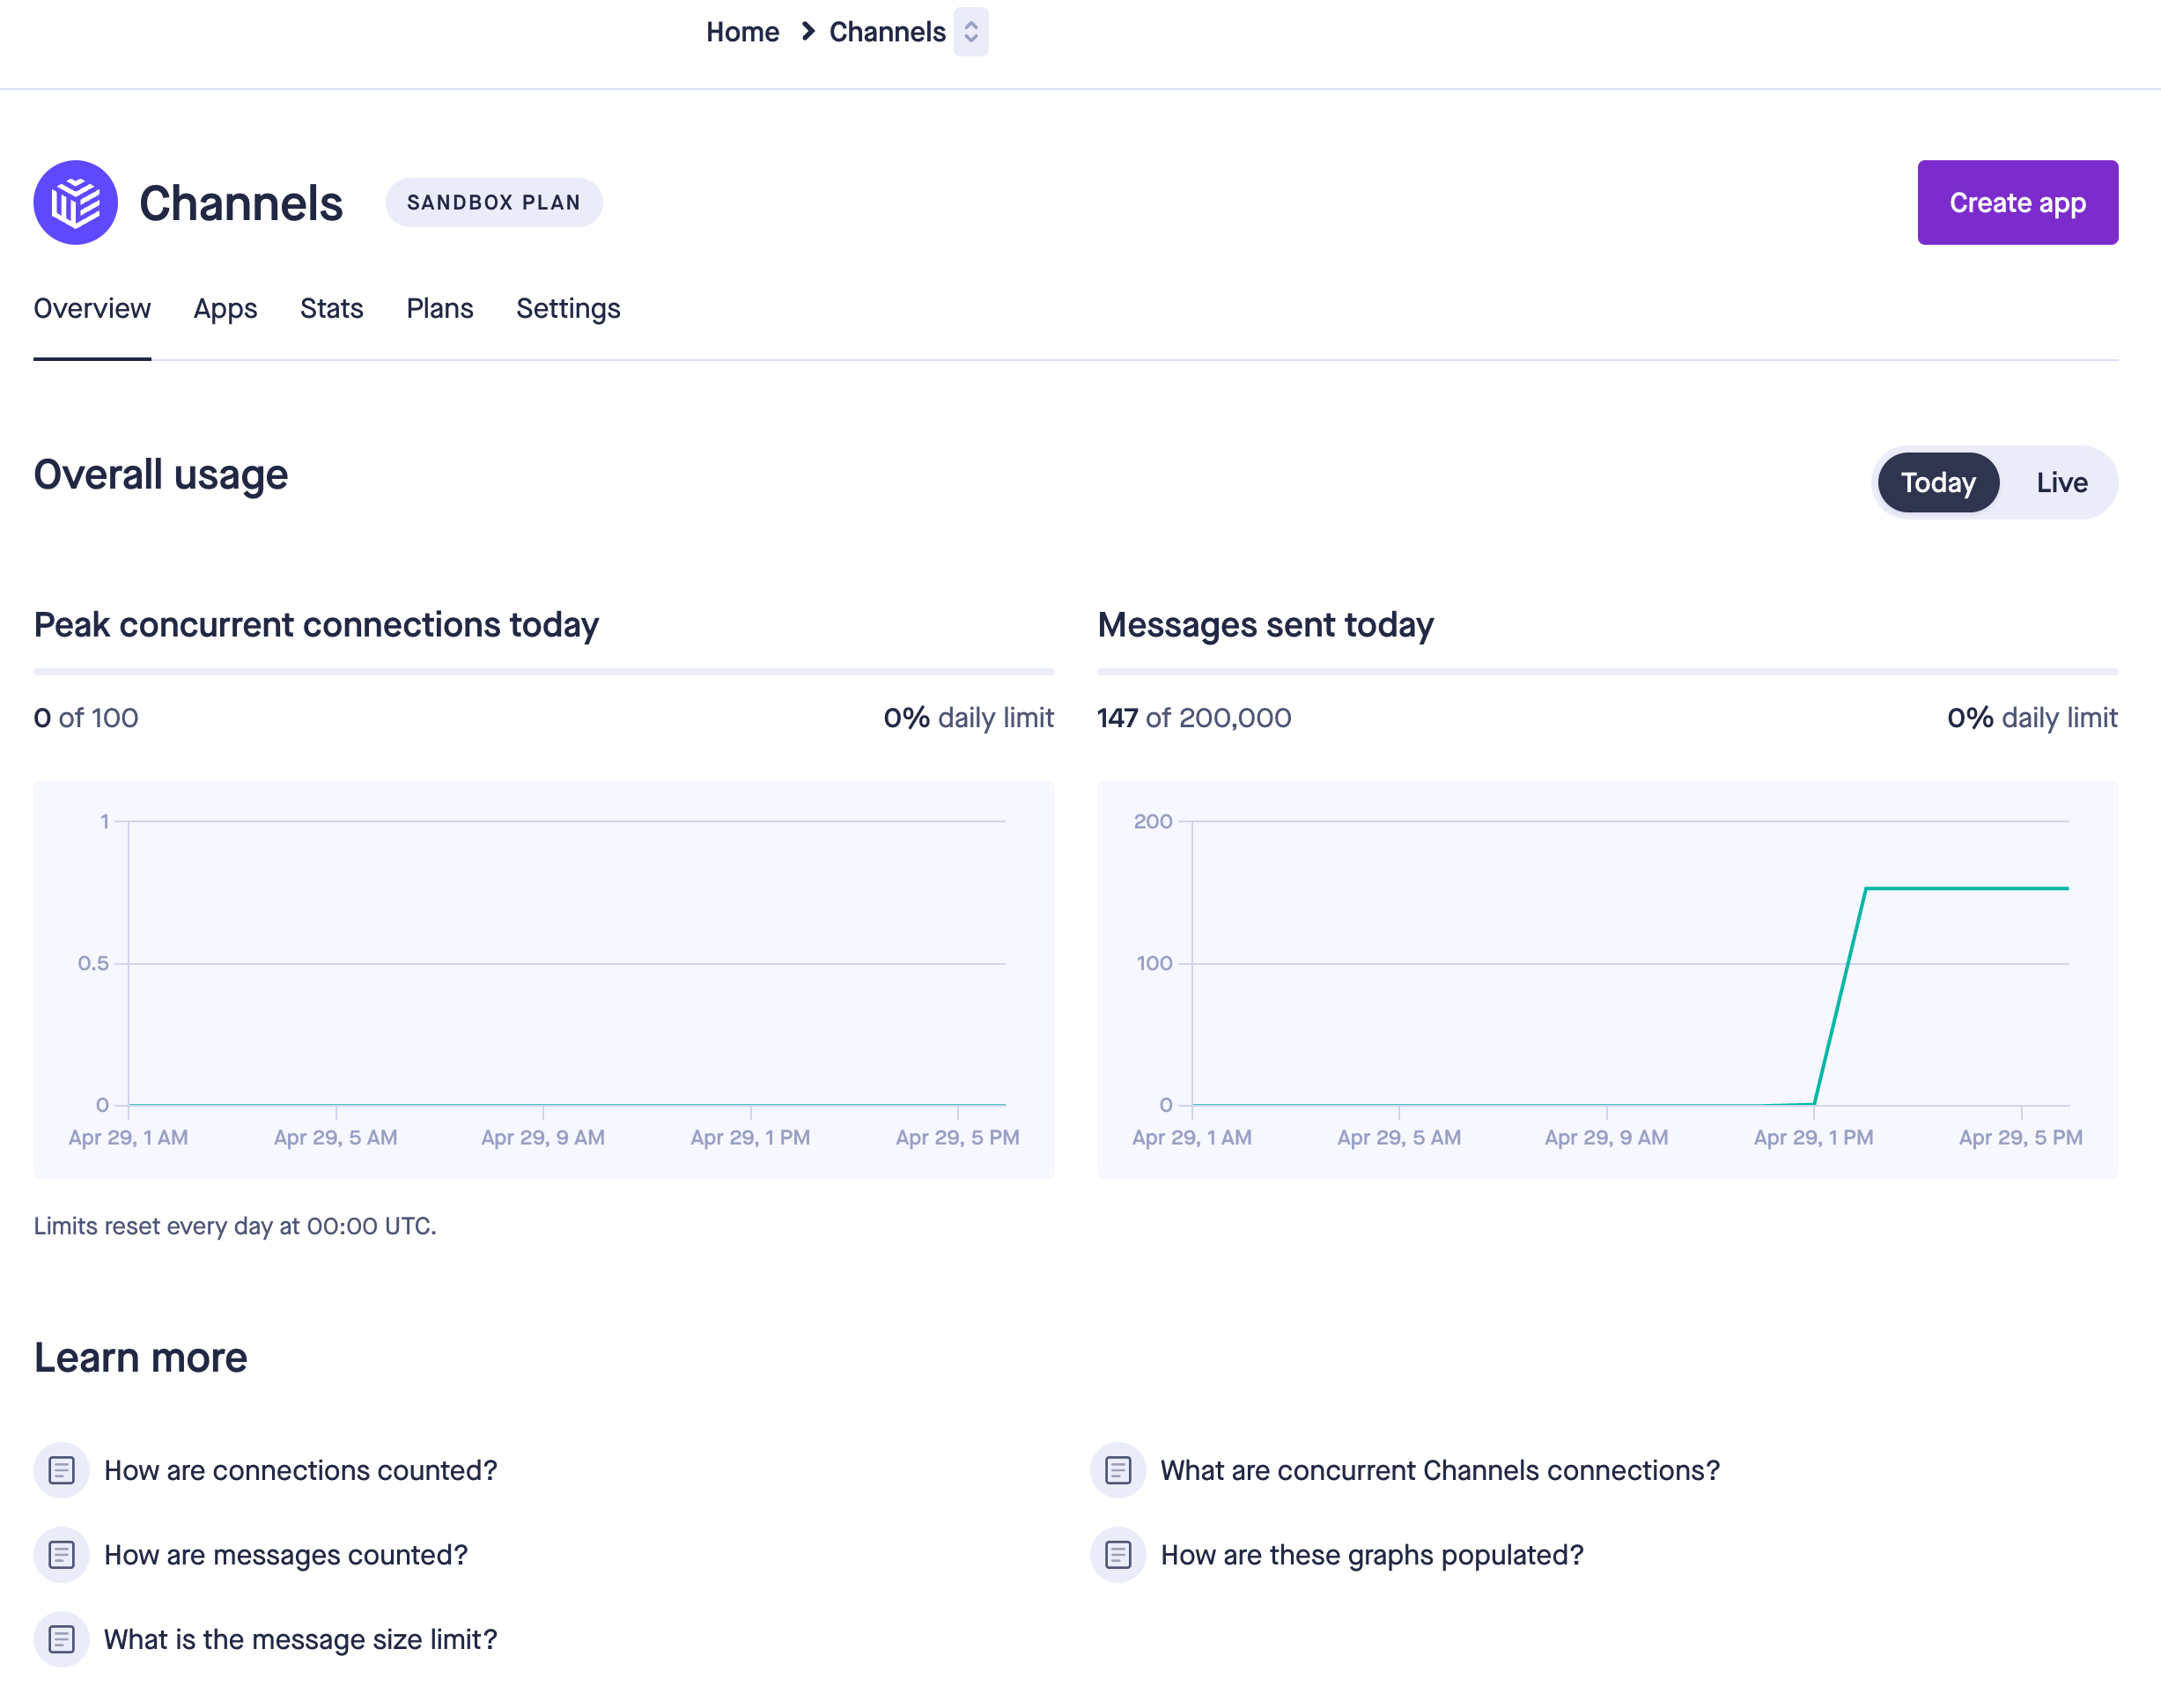
We need to create an app, so click on the Create app button in the top right hand corner.
Clicking on the button should give you this Create your Channels app box shown here:
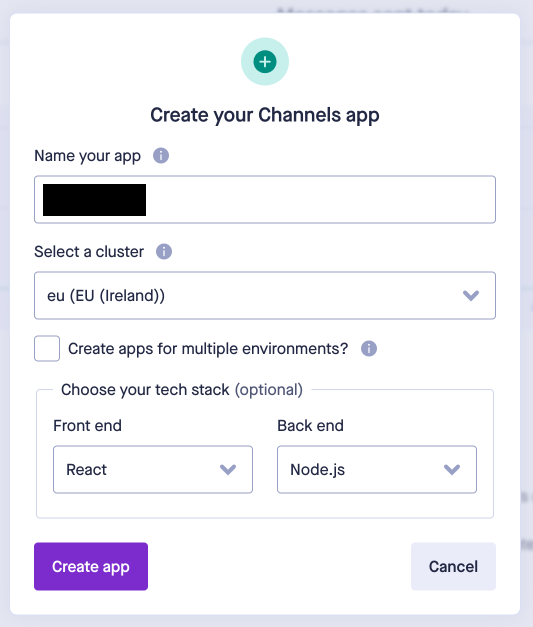
Give your app a name and then choose React for the front end and Node.js for the back end. Then click the Create app button at the bottom of the form.
That's it – you should now see the main screen for your app as shown in the example image below (with data for connections and messages shown in the middle). The sidebar on the left has the features and App keys which we need to use later.
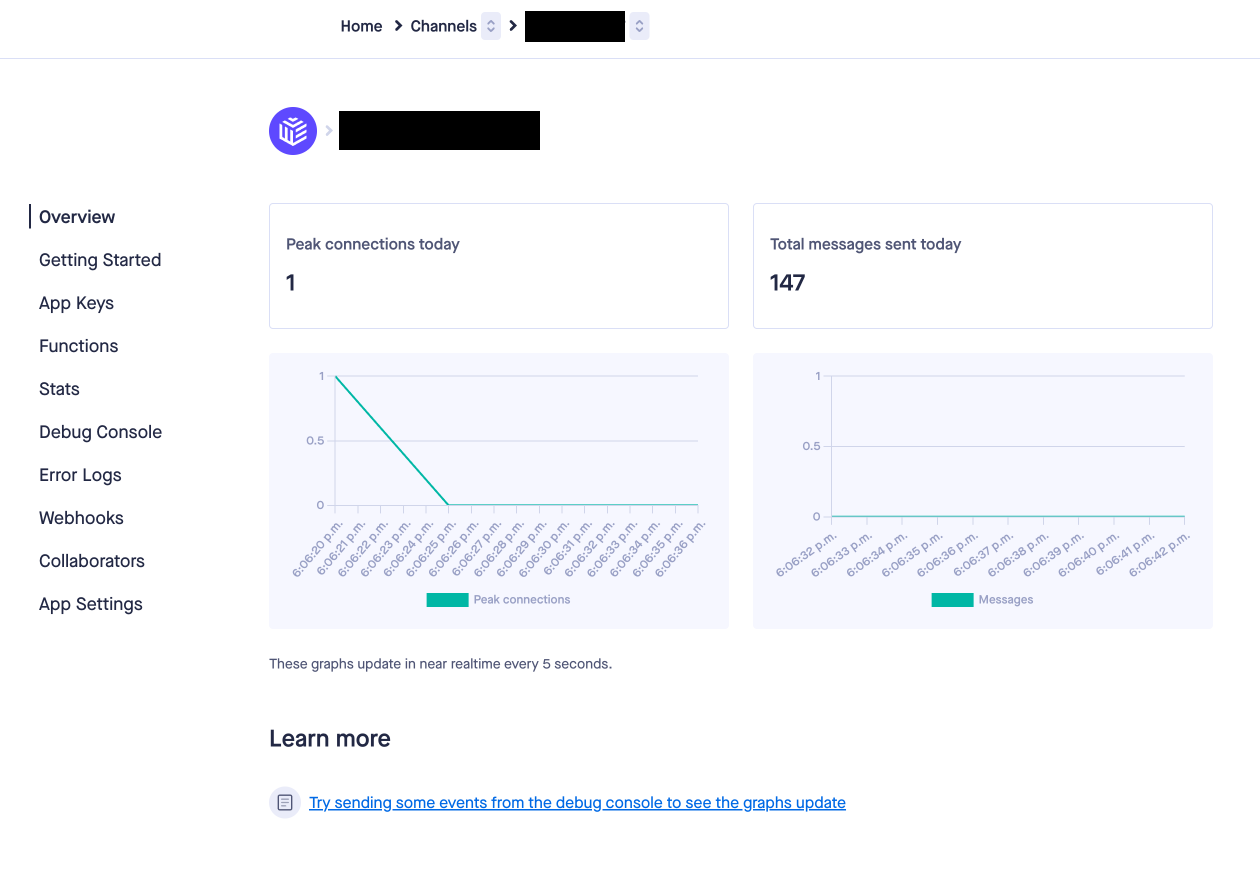
Great! Up next we will start building our app...so lets get to it.
How to Build the Company Annual Income Application
The first thing we have to do is setup our project architecture and the folder structure so let's start with that. Create a folder on your computer called realtime-chart-pusher and then cd into it.
Create a Next.js project by running the usual install and setup command here:
npx create-next-app .
On the configuration screen, our project needs to use Tailwind CSS for styling and its recommended that you use the App Router. The other defaults should be fine.
Now we have to install our dependencies for the project. Go ahead and do that with this command:
npm i axios highcharts-react-official pusher pusher-js
Here is a quick breakdown of the purpose of each package we are installing:
- Axios: for making API requests to our backend API which is connected to the Pusher API
- highcharts-react-official: for building our realtime chart
- pusher and pusher-js: for connecting to our Pusher account and the Pusher API
Right, with that done, we just have to setup our project files. You can use this run script in your terminal while still in the project root folder:
touch .env.local
cd src/app
mkdir -p api/pusher components/ChartButton components/CompanyIncomeChart components/Toggle3DButton
touch api/pusher/route.js
touch components/ChartButton/ChartButton.js components/CompanyIncomeChart/CompanyIncomeChart.js components/Toggle3DButton/Toggle3DButton.js
This script creates a .env.local file for our Pusher App keys. It also creates files and folders for our backend and frontend.
Before we begin adding the code to our codebase, we need to get our Pusher App Keys. You can find them on your Pusher account as shown in this example below:
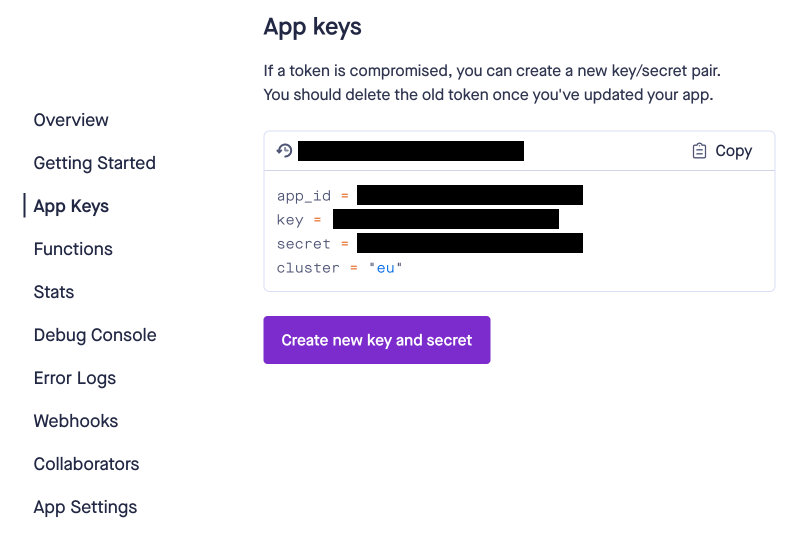
Add your app keys to the .env.local file like in this code example here:
NEXT_SECRET_PUSHER_APP_ID = "yourid"
NEXT_SECRET_PUSHER_KEY = "yourkey"
NEXT_SECRET_PUSHER_SECRET = "yoursecret"
NEXT_SECRET_PUSHER_CLUSTER = "yourlocation"
We just added NEXT_SECRET at the start of all of the variables because it is a Next.js convention and ensures that the variables work properly.
Now we can start with the bulk of our codebase. First we will do the route.js file inside of the api/route folder. This is the code needed for the file:
import Pusher from 'pusher';

const pusher = new Pusher({
  appId: process.env.NEXT_SECRET_PUSHER_APP_ID,
  key: process.env.NEXT_SECRET_PUSHER_KEY,
  secret: process.env.NEXT_SECRET_PUSHER_SECRET,
  cluster: process.env.NEXT_SECRET_PUSHER_CLUSTER,
  useTLS: true,
});

export async function GET() {
  // Define the initial value
  const value = Math.random() * 800000 + 200000;

  setInterval(() => {
    pusher.trigger('company-income', 'new-price', {
      value: value,
    });

    return Response.json({ value: value }, { status: 200 });
    // Every ten seconds, the setInterval method will get data from the API because its value is set to ten seconds. Pusher's free plans are limited to 200,000 messages a day, so be careful while reducing the interval or you risk exceeding your limit too soon.
  }, 10000);
  return Response.json({ value: value }, { status: 200 });
}
The code in this file lets us connect to Pusher using our App Keys. The value is a randomly generated number that gets sent as JSON to our Pusher channel. This number is what we use to show the company income in each new year which is automatically generated in our chart.
This update occurs every 10 seconds and can be changed in the setInterval function. Pusher's free plans are limited to 200,000 messages a day, so be careful while reducing the interval or you risk exceeding your limit too soon.
The next file we will work on is the ChartButton.js file which you can find inside its folder ChartButton.
Add this code to the file:
export default function ChartButton({ chartRef, type, name }) {
  const switchToLineChart = () => {
    chartRef.current.update({
      chart: {
        type: type,
      },
    });
  };

  return (
    <button
      onClick={() => switchToLineChart()}
      className="bg-indigo-500 hover:bg-indigo-700 p-2 rounded text-white shadow-md"
    >
      {name}
    </button>
  );
}
Our chart application has three buttons for Area Chart, Bar Chart, and Line Chart. This is basically just the component that creates the buttons.
Good, up next will be our CompanyIncomeChart.js file which you can find in the CompanyIncomeChart folder. This file will be taking this code here:
'use client';

import { useEffect, useRef, useState } from 'react';
import axios from 'axios';
import ChartButton from '../ChartButton/ChartButton';
import Toggle3DButton from '../Toggle3DButton/Toggle3DButton';

export default function CompanyIncome() {
  const initialData = [
    [1965, 360202],
    [1966, 400123],
    [1967, 460331],
    [1968, 460346],
    [1969, 460339],
    [1970, 460370],
  ];

  const chartRef = useRef(null);
  const [chartData, setChartData] = useState([...initialData]);
  const [toggle3D, setToggle3D] = useState(false);

  useEffect(() => {
    // Dynamically import Highcharts and its 3D module
    import('highcharts/highcharts-3d').then((Highcharts3D) => {
      import('highcharts').then((Highcharts) => {
        Highcharts3D.default(Highcharts.default);

        chartRef.current = Highcharts.default.chart('chart-container', {
          colors: ['#F3F7FB', '#F3F7FB'],
          chart: {
            style: {
              fontFamily: ['Prompt', 'sans-serif'],
              fontSize: '16px',
            },
            type: 'column',
            options3d: {
              enabled: toggle3D,
              alpha: 10,
              beta: 25,
              depth: 70,
              viewDistance: 25,
            },
            backgroundColor: {
              linearGradient: [0, 0, 500, 500],
              stops: [
                [0, 'rgb(128, 130, 221)'],
                [1, 'rgb(128, 130, 221)'],
              ],
            },
          },
          title: {
            text: 'COMPANY ANNUAL INCOME',
            style: {
              fontSize: '27px',
            },
          },
          xAxis: {
            title: {
              text: 'Year',
              style: {
                color: 'white',
              },
            },
            labels: {
              style: {
                color: 'white',
              },
            },
            type: 'category',
          },
          yAxis: {
            title: {
              text: 'Income',
              style: {
                color: 'white',
              },
            },
            labels: {
              style: {
                color: 'white',
              },
            },
            min: 0,
          },
          credits: {
            text: '',
          },
          series: [
            {
              name: 'Income',
              data: chartData,
            },
          ],
          animation: {
            duration: 100,
          },
        });
      });
    });

    const interval = setInterval(async () => {
      try {
        const response = await axios.get('/api/pusher');
        const newDataPoint = [
          chartData[chartData.length - 1][0] + 1,
          response.data.value,
        ];
        chartRef.current.series[0].addPoint(newDataPoint, true, true);
        setChartData((prevData) => [...prevData, newDataPoint]);
      } catch (error) {
        console.error('Error fetching data:', error);
      }
      // Every ten seconds, the setInterval method will get data from the API because its value is set to ten seconds. Pusher's free plans are limited to 200,000 messages a day, so be careful while reducing the interval or you risk exceeding your limit too soon.
    }, 10000);
    return () => {
      clearInterval(interval);
    };
  }, [toggle3D]);

  return (
    <div>
      <div id="chart-container" className="w-full h-96"></div>
      <div className="border-solid border-2 border-indigo-500 m-10">
        <div className="grid justify-center mt-5 text-center">
          <p>3D Mode</p>
          <div className="w-20">
            <Toggle3DButton toggle3D={toggle3D} setToggle3D={setToggle3D} />
          </div>
        </div>
        <div className="grid gap-4 justify-center mt-5 xl:grid-cols-3 p-4">
          <ChartButton chartRef={chartRef} type={'area'} name={'Area Chart'} />
          <ChartButton chartRef={chartRef} type={'bar'} name={'Bar Chart'} />
          <ChartButton chartRef={chartRef} type={'line'} name={'Line Chart'} />
        </div>
      </div>
    </div>
  );
}
This component creates our Company Income Chart and is already set with some initial loading data so that the chart loads some data when it first starts.
The file contains our chart configuration settings. There is a function that does a GET request to our Next.js backend which then connects to our Pusher account. This is how the data is retrieved for our chart file. Like on the backend, there is a setInterval function that runs every 10 seconds to get the latest data from our backend (we we can increase or decrease).
Next is the Toggle3DButton.js file in the Toggle3DButton folder. Here is the code for the file:
export default function Toggle3DButton({ toggle3D, setToggle3D }) {
  const toggle3DMode = () => {
    setToggle3D(!toggle3D);
  };

  return (
    <label className="flex items-center cursor-pointer border border-gray-400 rounded-full p-1 relative">
      <input
        type="checkbox"
        className="hidden"
        checked={toggle3D}
        onChange={toggle3DMode}
      />
      <span
        className={`toggle__line w-full h-4 bg-gray-400 rounded-full shadow-inner ${
          toggle3D ? 'bg-green-500' : 'bg-gray-400'
        }`}
      ></span>
      <span
        className={`toggle__dot absolute w-6 h-6 bg-white rounded-full shadow inset-y-0 ${
          toggle3D ? 'right-0' : 'left-0'
        }`}
      ></span>
    </label>
  );
}
Our application has a 3D Mode toggle and this component is used to create it.
The main files are completed – we just have three left and then we're done. Next is the globals.css file which needs this code to replace the existing code:
@import url('https://fonts.googleapis.com/css2?family=Bebas+Neue&family=Prompt:ital,wght@0,100;0,200;0,300;0,400;0,500;0,600;0,700;0,800;0,900;1,100;1,200;1,300;1,400;1,500;1,600;1,700;1,800;1,900&display=swap');

@tailwind base;
@tailwind components;
@tailwind utilities;

body {
  font-family: 'Prompt', sans-serif;
  font-weight: 400;
  font-style: normal;
}
We just imported the Prompt font to use in our application.
Continuing on from before, now we have to update the layout.js file so that it also uses the Prompt font. Add this code:
import { Prompt } from 'next/font/google';
import './globals.css';

const prompt = Prompt({ subsets: ['latin'], weight: '400' });

export const metadata = {
  title: 'Create Next App',
  description: 'Generated by create next app',
};

export default function RootLayout({ children }) {
  return (
    <html lang="en">
      <body className={prompt.className}>{children}</body>
    </html>
  );
}
Now we can access the Prompt font throughout our application with this import and update.
All that remains is our page.js file which is the main entry point for all of our components. Replace all the code in that file with this final code shown here:
import CompanyIncomeChart from './components/CompanyIncomeChart/CompanyIncomeChart';

export default function Home() {
  return <CompanyIncomeChart />;
}
Alright all done – our project codebase is complete!
Just return to the root project folder and run the command below. Your application should be up and running in a web browser.
npm run dev
Everything should be working, and now you should have a realtime chart with live random dates.
Conclusion
Realtime communication platforms are essential for all of the tech that we use. Today you learned about Pusher and how it can help you build realtime data applications that can integrate with a chart library like HighCharts.
There are lots of potential applications you can build with these tools. Today's introduction should open the door and give you many ideas for future projects.