

When creating plots using Matplotlib, you get a default figure size of 6.4 for the width and 4.8 for the height (in inches).
In this article, you'll learn how to change the plot size using the following:
- The
figsize()attribute. - The
set_figwidth()method. - The
set_figheight()method. - The
rcParamsparameter.
Let's get started!
How to Change Plot Size in Matplotlib with plt.figsize()
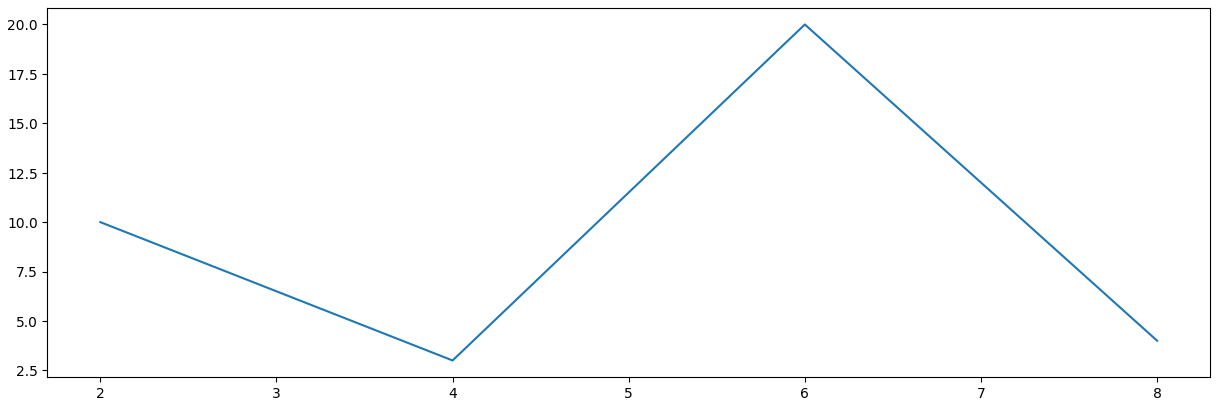
As stated in the previous section, the default parameters (in inches) for Matplotlib plots are 6.4 wide and 4.8 high. Here's a code example:
import matplotlib.pyplot as plt

x = [2,4,6,8]
y = [10,3,20,4]

plt.plot(x,y)

plt.show()
In the code above, we first imported matplotlib. We then created two lists — x and y — with values to be plotted.
Using plt.plot(), we plotted list x on the x-axis and list y on the y-axis: plt.plot(x,y).
Lastly, the plt.show() displays the plot. Here's what the plot would look like with the default figure size parameters:

We can change the size of the plot above using the figsize() attribute of the figure() function.
The figsize() attribute takes in two parameters — one for the width and the other for the height.
Here's what the syntax looks like:
figure(figsize=(WIDTH_SIZE,HEIGHT_SIZE))Here's a code example:
import matplotlib.pyplot as plt

x = [2,4,6,8]
y = [10,3,20,4]

plt.figure(figsize=(10,6))
plt.plot(x,y)

plt.show()
We've added one new line of code: plt.figure(figsize=(10,6)). This will modify/change the width and height of the plot.
Here's what the plot would look like:

How to Change Plot Width in Matplotlib with set_figwidth()
You can use the set_figwidth() method to change the width of a plot.
We'll pass in the value the width should be changed to as a parameter to the method.
This method will not change the default or preset value of the plot's height.
Here's a code example:
import matplotlib.pyplot as plt

x = [2,4,6,8]
y = [10,3,20,4]

plt.figure().set_figwidth(15)
plt.plot(x,y)

plt.show()
Using the set_figwidth() method, we set the width of the plot to 10. Here's what the plot would look like:
How to Change Plot Height in Matplotlib with set_figheight()
You can use the set_figheight() method to change the height of a plot.
This method will not change the default or preset value of the plot's width.
Here's a code example:
import matplotlib.pyplot as plt
x = [2,4,6,8]
y = [10,3,20,4]
plt.figure().set_figheight(2)
plt.plot(x,y)
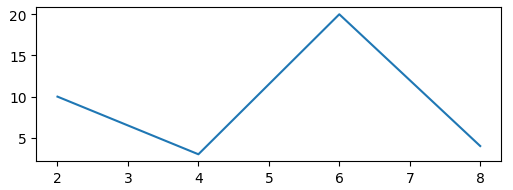
plt.show()Using the set_figheight() in the example above, we set the plot's height to 2. Here's what the plot would look like:

How to Change Default Plot Size in Matplotlib with rcParams
You can override the default plot size in Matplotlib using the rcParams parameter.
This is useful when you want all your plots to follow a particular size. This means you don't have to change the size of every plot you create.
Here's an example with two plots:
import matplotlib.pyplot as plt
x = [2,4,6,8]
y = [10,3,20,4]
plt.rcParams['figure.figsize'] = [4, 4]
plt.plot(x,y)
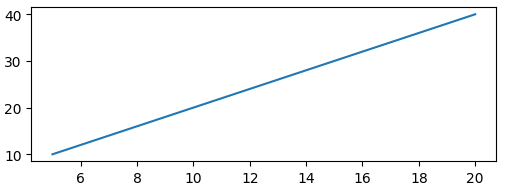
plt.show()a = [5,10,15,20]
b = [10,20,30,40]
plt.plot(a,b)Using the figure.figsize parameter, we set the default width and height to 4: plt.rcParams['figure.figsize'] = [4, 4]. These parameters will change the default width and height of the two plots.
Here are the plots:
Summary
In this article, we talked about the different ways you can change the size of a plot in Matplotlib.
We saw code examples and visual representation of the plots. This helped us understand how each method can be used to change the size of a plot.
We discussed the following methods used in changing the plot size in Matplotlib:
- The
figsize()attribute can be used when you want to change the default size of a specific plot. - The
set_figwidth()method can be used to change only the width of a plot. - The
set_figheight()method can be used to change only the height of a plot. - The
rcParamsparameter can be used when want to override the default plot size for all your plots. Unlike the thefigsize()attribute that targets a specific plot, thercParamsparameter targets all the plots in a project.
Happy coding!